


Gaussian Mixture Model (GMM)
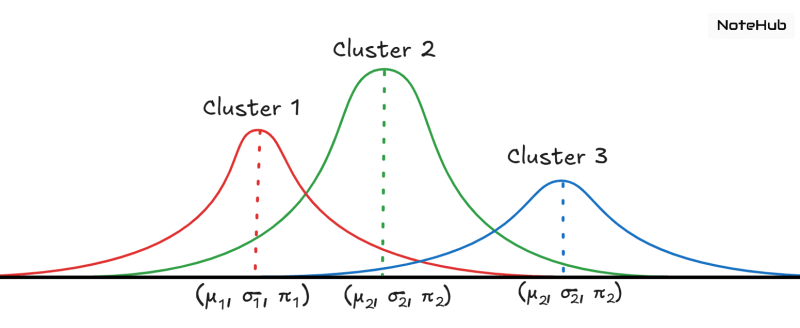
A Gaussian Mixture Model is a probabilistic clustering method that assumes data points are generated from a mixture of multiple Gaussian distributions whose parameters are unknown.
Unlike K-Means, which does hard clustering (each point belongs to exactly one cluster), GMM performs soft clustering, meaning every point has a probability of belonging to each cluster.

Working of GMM (By Dimri Sir)
Assume we have K Gaussian clusters.
Each cluster corresponds to a Gaussian distribution with its own mean and covariance.
For a data point , the probability that it belongs to cluster is:
Where:
- → latent variable indicating point belongs to cluster
- → mixing coefficient for the Gaussian
- → Gaussian distribution with mean and covariance
The overall likelihood of observing data point is:
Expectation–Maximization (EM) Algorithm
To fit a GMM to data, we use the EM algorithm, an iterative method that optimizes the parameters
1. E-Step (Expectation)
Calculate the responsibility of each cluster for every data point:
- How likely is point to belong to cluster
- Based on current estimates of mean, covariance, and mixing coefficients
2. M-Step (Maximization)
Update the parameters:
- Update means
- Update covariances
- Update mixing coefficients
These updated parameters maximize the likelihood of observing the data.
The process repeats until convergence.
Working of GMM (My Own)
1. Initialization
Choose:
- Number of clusters
- For each cluster:
- Mean
- Covariance
- Weight
Values are initially random or taken from K-Means.
2. E-Step (Expectation Step)
Compute responsibility for each data point:
👉 Probability that a data point belongs to each cluster.
Formula (conceptually):
- If the point is close to cluster mean → high probability
- If far → low probability
This assigns soft memberships.
3. M-Step (Maximization Step)
Update the parameters based on responsibilities:
- New means = weighted average of points
- New covariances = weighted spread
- New weights = how much responsibility each cluster has
So clusters get reshaped according to data.
4. Repeat until convergence
Keep repeating:
E-Step → M-Step → E-Step → M-Step
until the parameters stop changing.
Output
GMM gives:
- The final clusters
- For each point → probability of belonging to each cluster
- Cluster shapes (elliptical, not circular like K-Means)
EM Algorithm
11 Oct 2025
1. Initialization
Randomly initialize the parameters for each of the Gaussians:
- Means
- Covariances
- Mixing coefficients
2. E-Step (Expectation)
Calculate the responsibility.
3. M-Step (Maximization)
Update the parameters.
4. Convergence
Repeat E-step and M-step until:
- Parameters stop changing significantly, or
- Likelihood converges.
Applications of GMM
1. Clustering
Find hidden groups in data.
Used in:
- Marketing
- Medicine
- Genetics
- Customer segmentation
2. Anomaly Detection
Identify rare or unusual patterns, e.g.,
- Fraud detection
- Medical error detection
- Network intrusion detection
3. Image Segmentation
Divide images into meaningful regions.
Used in:
- Medical imaging
- Remote sensing
- Military applications
4. Density Estimation
Model complex probability distributions for:
- Generative modeling
- Sampling
- Feature understanding
Advantages of GMM
- Flexible cluster shapes
Can model ellipsoidal / overlapping clusters (unlike K-Means). - Soft assignment
Assigns probabilities instead of hard labels. - Handles missing data
More robust to incomplete observations. - Interpretable parameters
Each Gaussian has:- Mean
- Covariance
- Mixing coefficient
All easy to analyze and understand.